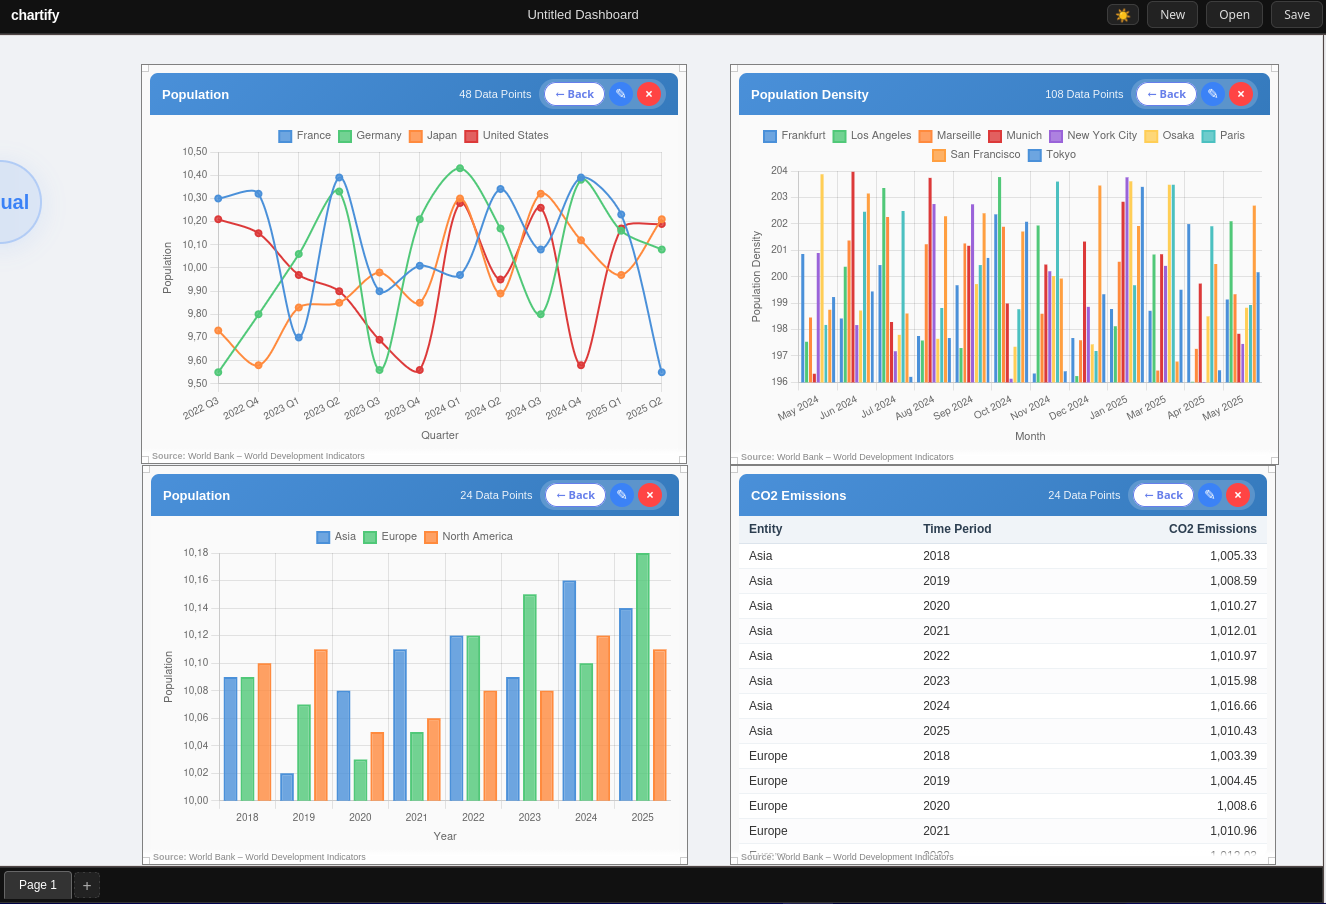
Charthub is an interactive data visualization editor. Connect your datasets, slice by hierarchy, and create publication-ready charts and tables — all in the browser, with no code required.
Enter EditorVisualize your data as an animated bar chart, a smooth line plot, or a sortable data table — switch between views instantly.
Filter by specific entities, time periods, value ranges, or apply preset views like "Last 5 periods" or "Top 10 values" with a single click.
Work with nested geographies — select a continent and the country dropdown cascades automatically. Full ancestor-chain filtering at every level.
Customise axis labels, font size, font family, legend position, and grid lines. Changes apply live — no apply button required.
Every chart automatically shows its data source as a subtle overlay. Clickable links lead directly to the original dataset.
Place multiple visual frames anywhere on the canvas. Drag, resize, and arrange them into a custom dashboard layout.
Pick an entity type (e.g. Countries), a time unit (e.g. Year), and a variable (e.g. Population) using the chip selector.
Switch between Bar chart, Line plot, or Table view. Charthub re-renders instantly as you switch.
Open the Edit panel to filter entities, set time ranges, adjust appearance, and focus on exactly the data that matters.